I’ve recently added a VGP map display to PuffinPlot. In principle, this is fairly straightforward to implement: the program produces a list of global locations (longitude and latitude pairs), and I needed to overlay these on a small wireframe world map.
Since I needed to project my locations in any case, it made sense to code the projection of the map itself as well rather than using pre-projected map data: that way I could have flexibility in changing the map projection, and confidence that my points were being correctly placed.
The first step was to find some global coastline data at a suitably low resolution and in a sufficiently tractable format. After a little googling, I found what I needed in the 110m physical vector data set from Natural Earth. The coastline download is under 100 kB, and contains (amongst other things) an ESRI shapefile (.shp). Since the shape data was going to be baked into the program anyway, I preferred not to add another dependency by using one of the available ESRI readers for Java, and instead preprocessed the .shp file to a more directly readable format. The ogr2ogr utility from the GDAL package can do this:
ogr2ogr -f CSV ~/coastline.csv ne_110m_coastline/ne_110m_coastline.shp -lco GEOMETRY=AS_WKT
This produces a CSV file with one line per shape (134 in all, plus a header line). The first field in each line is of the form:
"LINESTRING (-163.71289567772871 -78.595667413241543,-163.105800951163786 -78.223338718578589,-161.245113491846439 -78.869965915846805,-163.71289567772871 -78.595667413241543)"
with as many longitude-latitude pairs within the parenthesis as it takes to describe the shape. A few minutes of hammering away with emacs macros shaved off the excess decimal places (it appears that keeping them all would give precision on the order of one nanometre) and turned them into unadorned lines of comma-separated, alternating longitudes and latitudes, thus:
-163.7129, -78.5957, -163.1058, -78.2233, -161.2451, -78.3802, -163.7129, -78.5957
This is the format in which PuffinPlot reads it. Before diving into the projection code in PuffinPlot, I checked the data with a very quick Python script:
#!/usr/bin/env python3

from matplotlib import pyplot

with open("coast.csv", "r") as fh:
    for line in fh.readlines():
        parts = line.split(", ")
        pyplot.plot(parts[::2], parts[1::2])

pyplot.show()
The result was satisfactory, and pleasingly colourful:
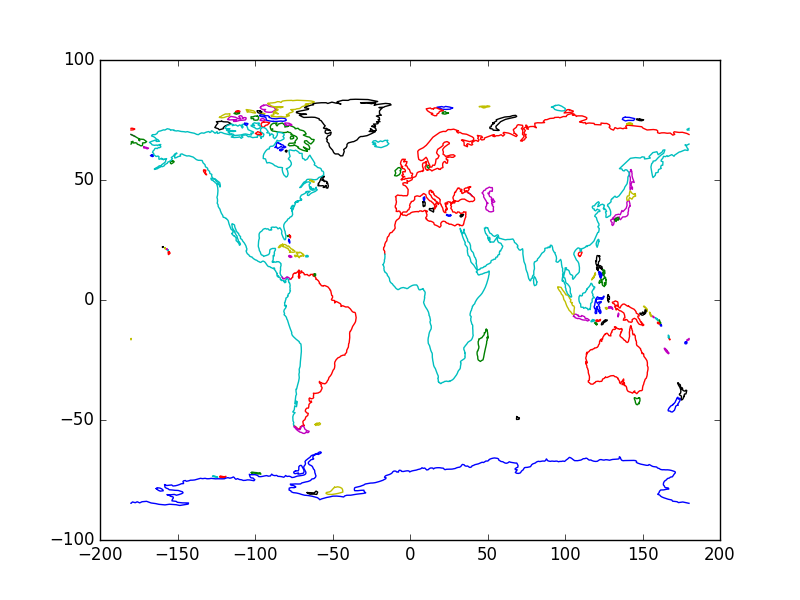
This simply plots longitude as x and latitude as y (a plate carrée projection); PuffinPlot instead uses the Mollweide projection, which seems to be a popular choice for global geomagnetic data. Implementing the projection from Wikipedia’s description didn’t produce any surprises.
Incidental notes:
- My first attempt to get the data into Java was to transform it into a huge array literal, avoiding the need to parse a text file at runtime. unfortunately the resulting literal came to around 100 kB of source code, which the Java compiler refused with a curt code too large.
- While cutting down the excessive decimal places, I discovered that emacs’ search-and-replace can easily round rather than simply truncate numbers: [0-9]+\.[0-9]+ as the search string and \,(format "%0.4f" \#&) as the replace string did the trick. I still have a lot to learn about emacs; after all, I've only been using it for twenty years.